Note
To run this notebook in JupyterLab, load examples/ex3_0.ipynb
Interactive graph visualization with pyvis
First, let's visualize a small graph using the popular pyvis library:
import pyvis.network

pyvis_graph = pyvis.network.Network(notebook=True)

pyvis_graph.add_node(0, label="foo", title="This is FOO", color="orange", size=9)
pyvis_graph.add_node(1, label="bar", title="That is BAR", color="blue", size=5)
pyvis_graph.add_node(2, label="baz", title="Here is BAZ", color="green", size=3)

pyvis_graph.add_edge(0, 1, label="xyzzy", color="gray")
pyvis_graph.add_edge(0, 2, label="fubar", color="red")

pyvis_graph.force_atlas_2based()
pyvis_graph.show("tmp.fig02.html")
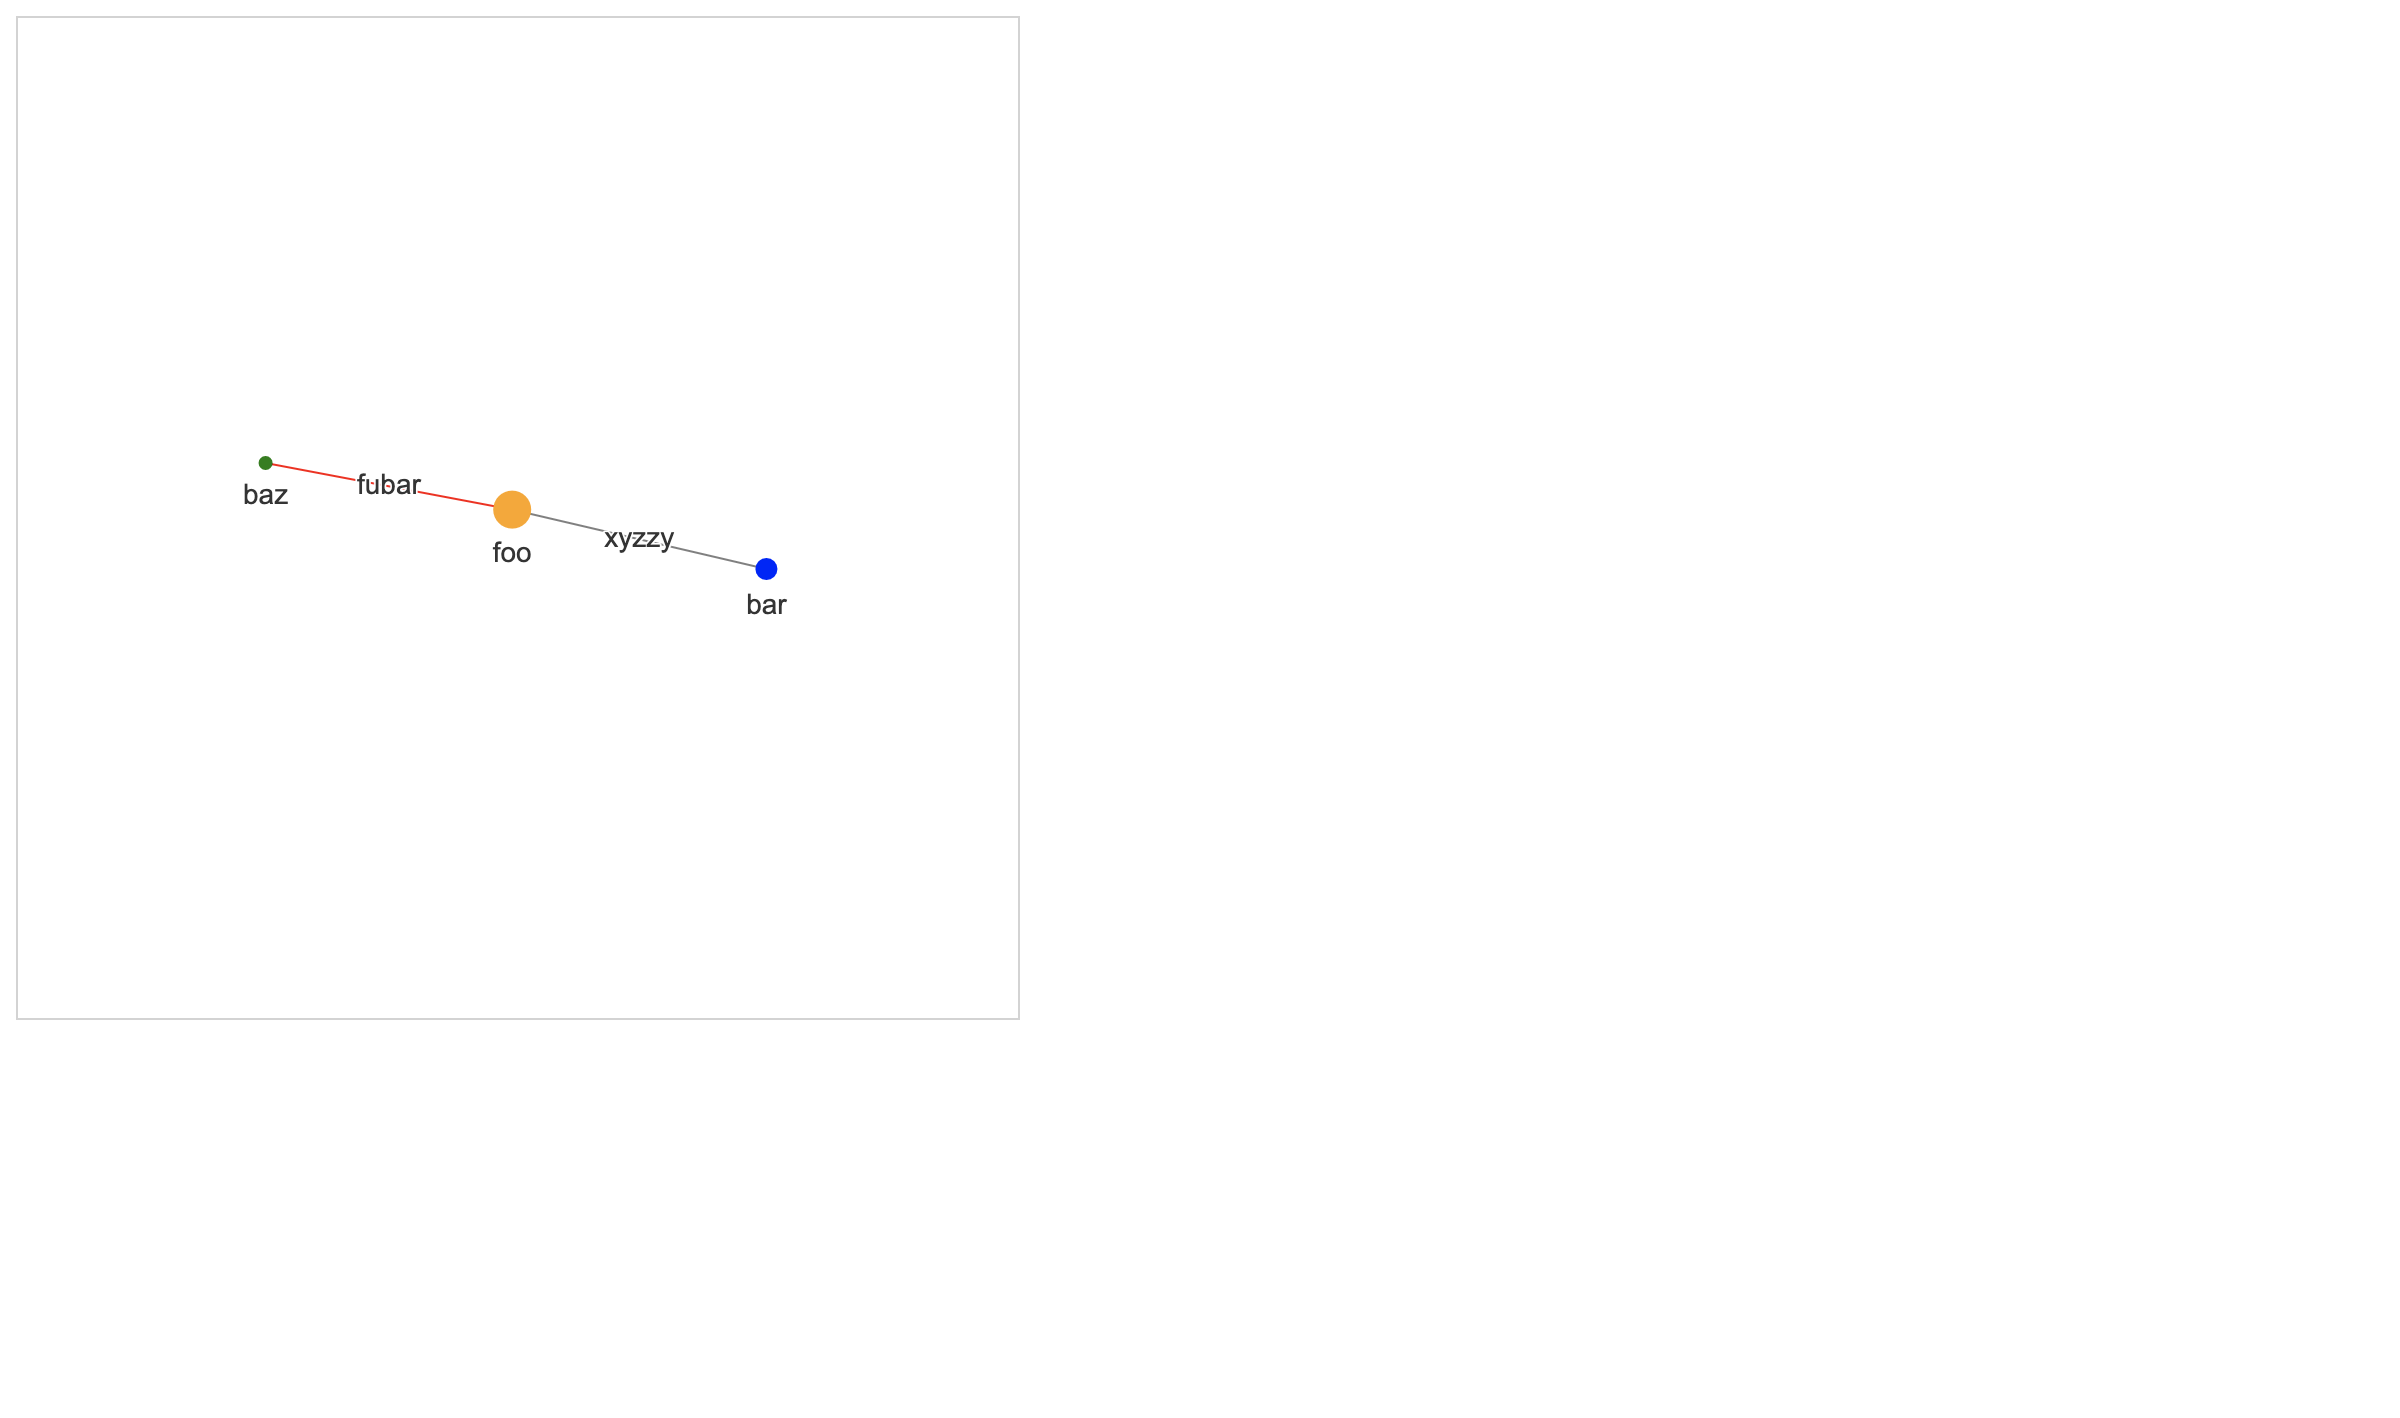
Hover your mouse pointer over the nodes to see the popup titles. Also, try dragging a node to a different location to see how the graph reshapes dynamically.
Graph visualization with kglab using subgraphs
First, let's load our recipe KG:
import kglab

kg = kglab.KnowledgeGraph().load_rdf("tmp.ttl")
Then use the SubgraphTensor class to construct a pyvis object from the RDF statements in our KG:
VIS_STYLE = {
    "wtm": {
        "color": "orange",
        "size": 40,
    },
    "ind":{
        "color": "blue",
        "size": 30,
    },
}

subgraph = kglab.SubgraphTensor(kg)
pyvis_graph = subgraph.build_pyvis_graph(notebook=True, style=VIS_STYLE)
Now we'll general an interactive visualization, which gets serialized as HTML + JavaScript into the tmp.fig03.html local file:
pyvis_graph.force_atlas_2based()
pyvis_graph.show("tmp.fig03.html")
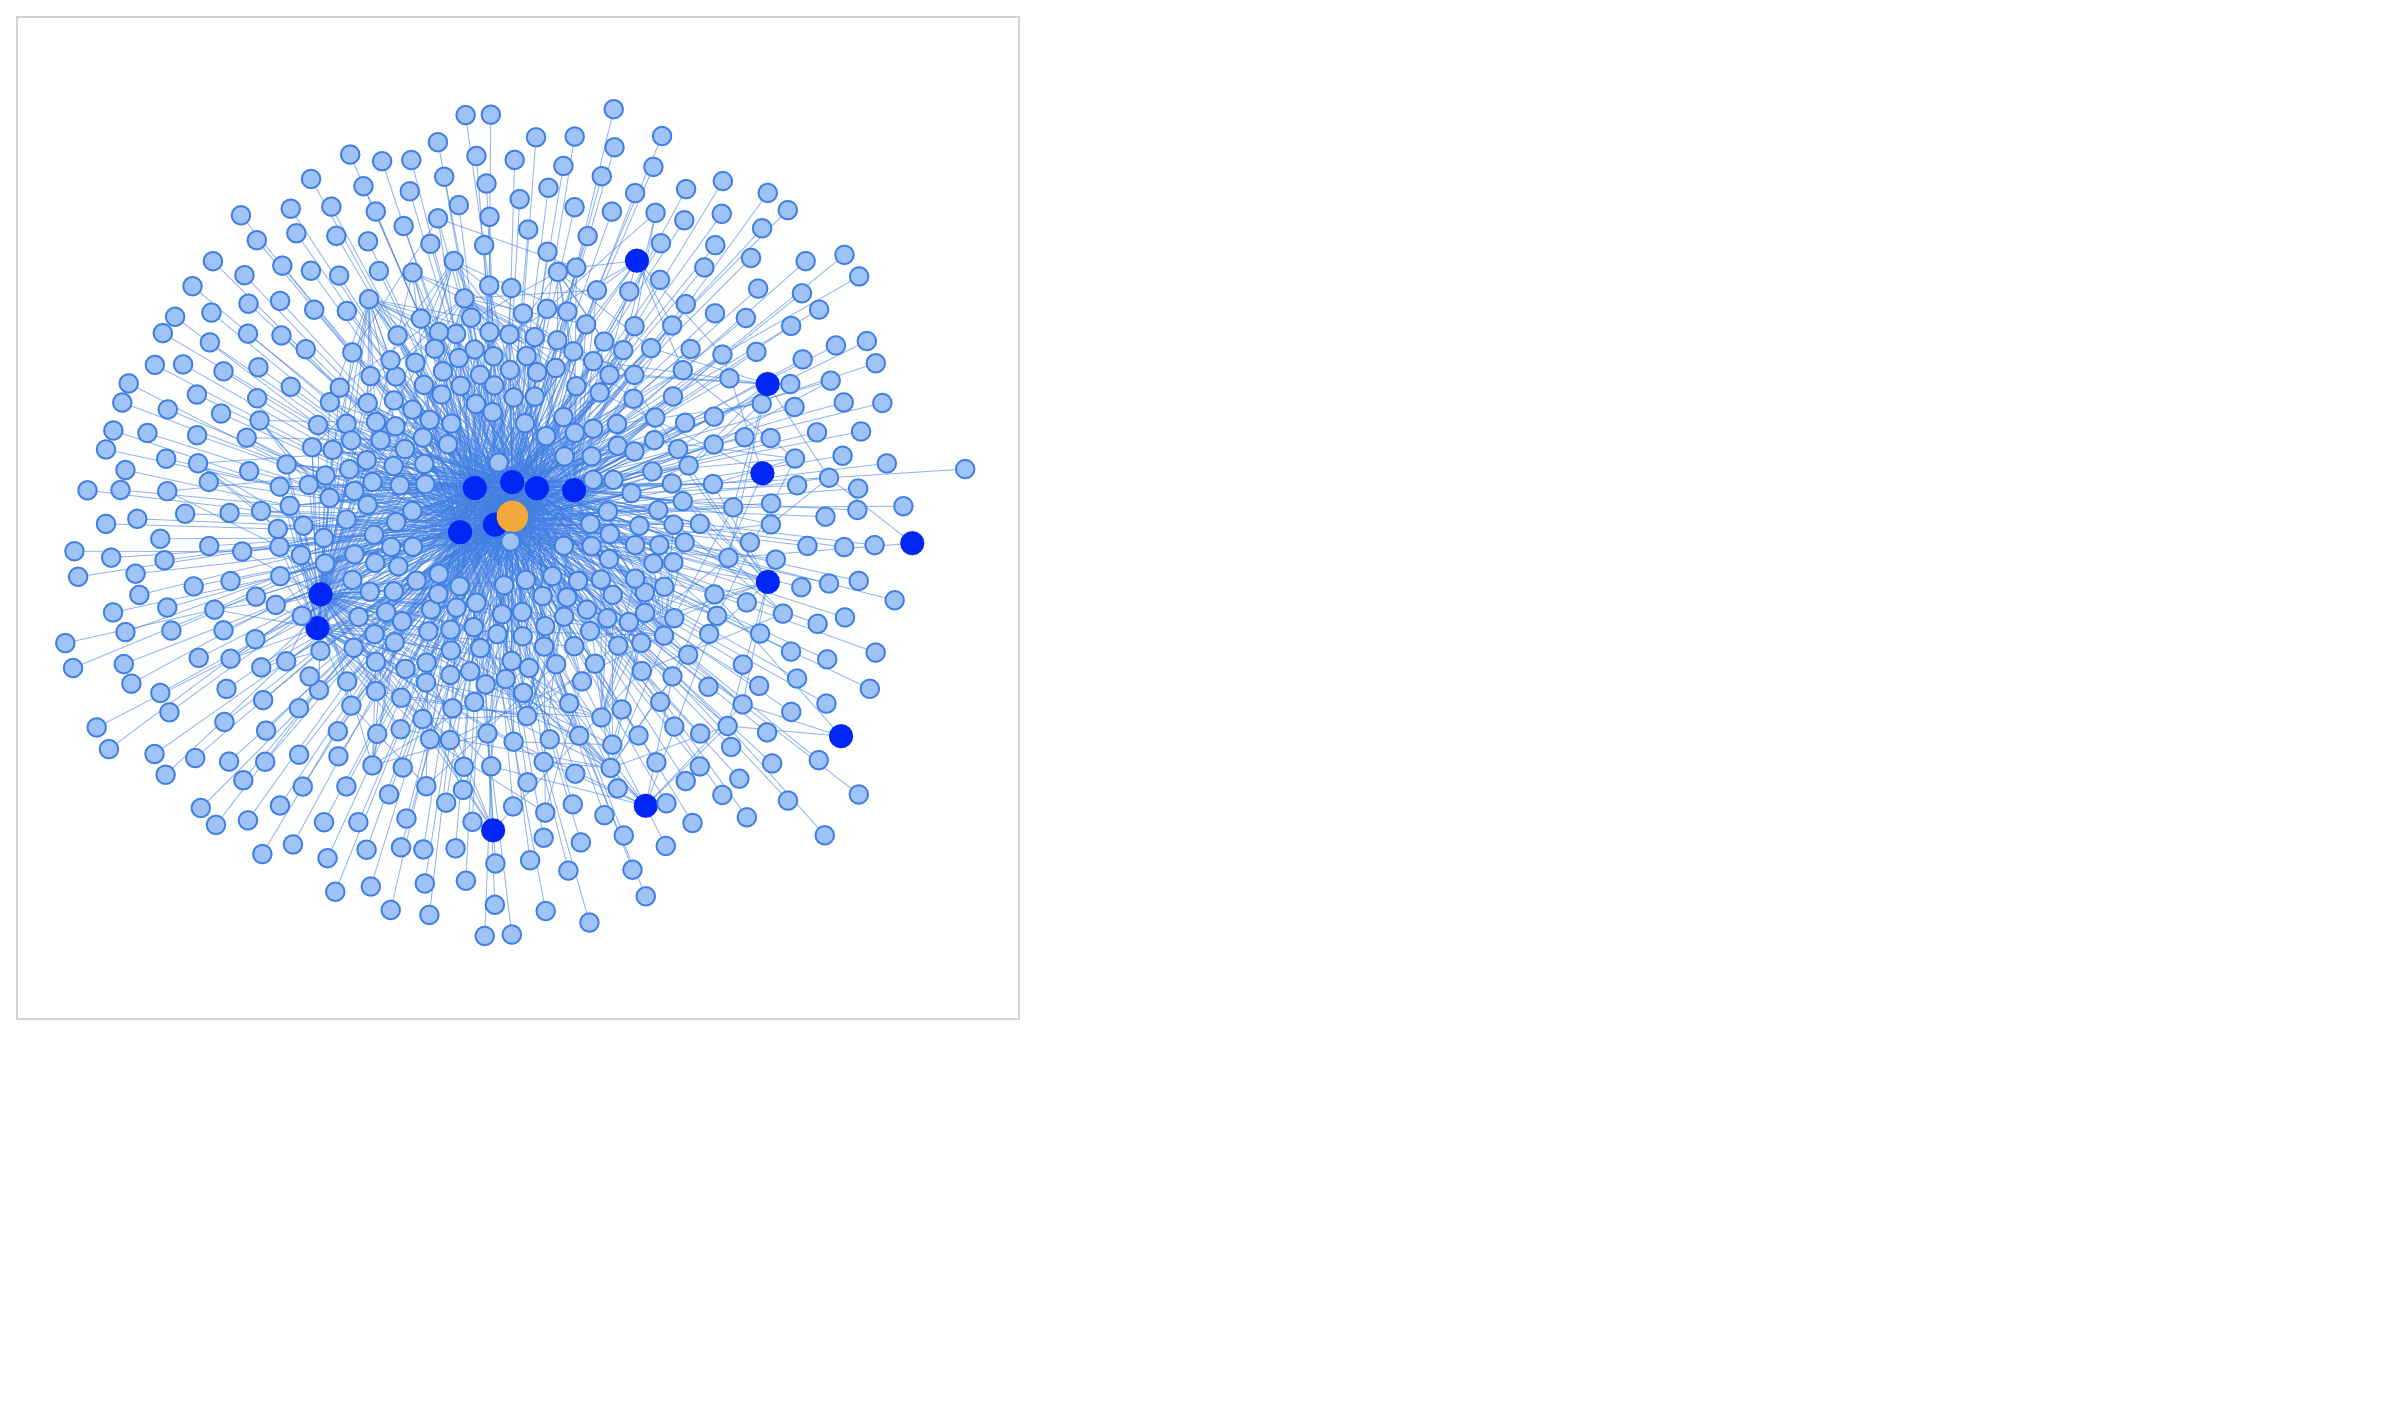
Dragging the nodes in the graph or zoom-in/zoom-out may help make the labels in the visualization more readable.
Exercises
Exercise 1:
Try adjusting the color and size parameters in the VIS_STYLE configuration variable, then re-render the graph.
Also try adding another recipe to the graph, then re-render to see how the visualization becomes more complex as the graph grows in size.